About
From raw data
to a finished map
Maps have been with me far longer than I realised at the time. I drew my first one as a kid, around fourth or fifth grade, spent school summers on archaeological digs, and later worked as a junior research fellow in our regional museum, drawing maps and graphics as much as anything else.
I went on to study architecture and urban design at the Kyiv National University of Construction and Architecture, where geodesy and surveying gave that early instinct a foundation — six years that ended with a diploma project mapping and planning the future of a whole city agglomeration at 1:25,000.
For a long time it was all there without a name. The turning point came through research: since 2005 I've been studying ruined and lost parks, reading the terrain to recover the logic their designers built into them. That work is exactly what put GIS tools in my hands — and the search for missing data led me to OpenStreetMap, where I've been an active contributor ever since.
I'm Fedir Gontsa (Федір Гонца · FEH-dir GON-tsa), a cartographic designer and GIS specialist in Cherkasy. Mapping has been my main profession for close to a decade, and across seven seasons of the #30DayMapChallenge every map I've made has been about Ukraine — its landscapes, its heritage, the work of turning open data into maps people genuinely want to look at. For nearly twenty-five years I've also taught design and spatial thinking to art students, work that ranges from reconstructing lost monuments to building new forms with AR and animation.
Architecture itself has shifted from a profession into a field I study and help reconstruct. Around all of it I draw, model and photograph — it's the same instinct throughout: making sense of space, and giving it a form other people can read.
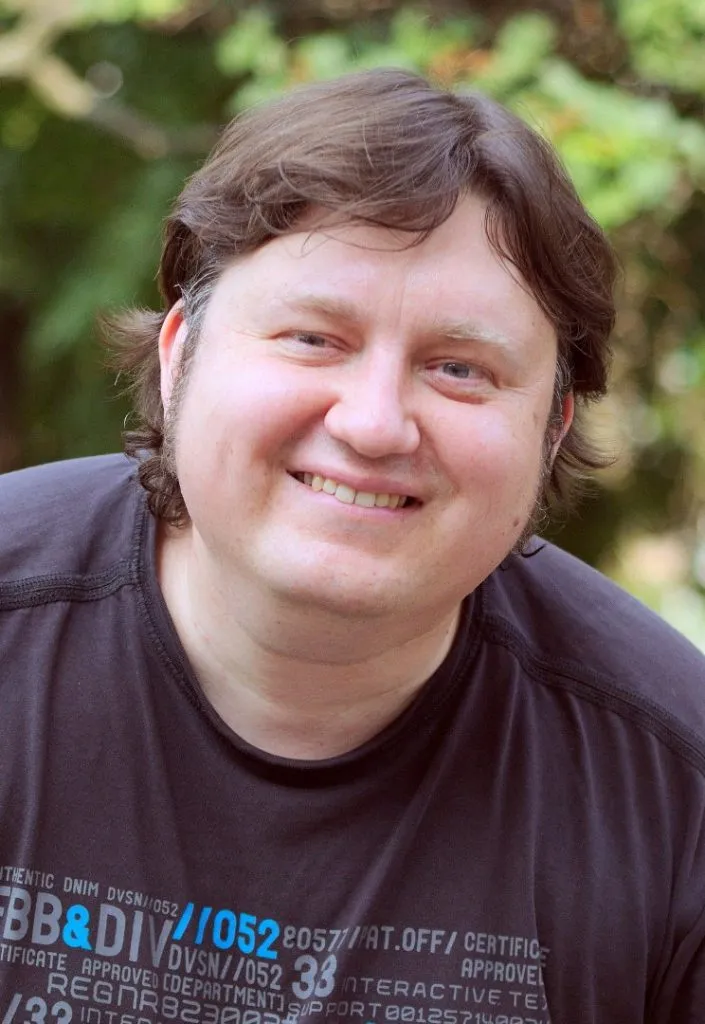
Fedir Gontsa
What I do These days, in four forms.
Print cartography
Maps for books, atlases, and posters — work made for paper, where typography, hierarchy, and fine detail have to stay sharp at full resolution.
Interactive web maps
Web maps, dashboards, and map-driven stories — custom-styled, smooth to move through, and built so the data can change without rebuilding everything around it.
Spatial analysis / GIS
Terrain, networks, isochrones, modelling — the analytical work that sits under a map, kept transparent enough to check and run again.
Data & visualization
Most of it starts in mess: spatial data to clean, join, and shape until it reads at a glance. This is the quiet groundwork the rest depends on.
Path so far
Tools & tech
Everything I make runs mostly on open-source software
— and has for over twenty years.
Design
- QGIS
- Inkscape
- Blender
- GIMP
GIS & analysis
- SAGA GIS
- GRASS
- GDAL / OGR
- JOSM
- PostGIS
Web mapping
- MapLibre GL
- Mapbox GL
- Leaflet
- OpenLayers
Code
- Python
- JavaScript
- Bash
- PHP
Artist statement
For over ten years I have been doing essentially one thing: trying to understand space and give it a form that others can read. A map is not an illustration, and not a technical product — it is a way of thinking.
A short essay on what I look for in a map: honesty with data, a sense of place, and the conviction that a map, like any work, takes a position. Available to read in full as a PDF, in English and Ukrainian.